Stardust Racers Wait Times
Average that day
39min
Thu, Apr 17
Hours
Opens 10am
Posted hours
Range
15–100 min
Low 10:13am · high 1:02pm
Typical Thursday
22 min
17 min busier that day
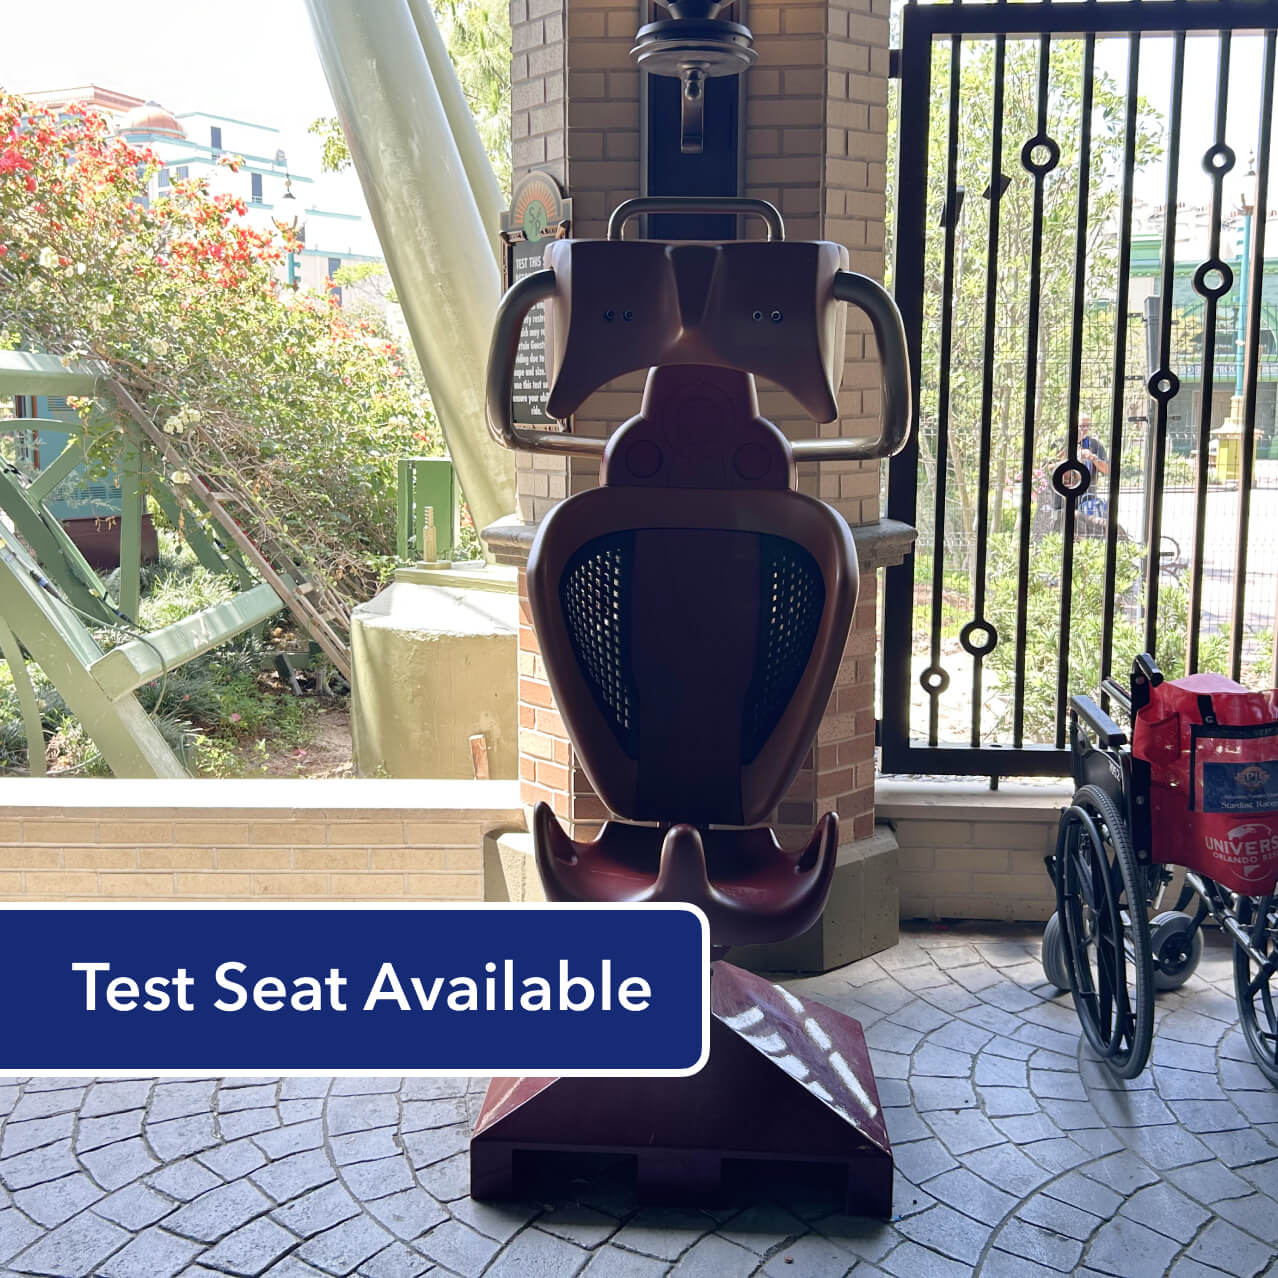 Photo: Universal
Climb aboard a comet and race across the stars on this dual-launch coaster which blazes through the cosmos at incredible speed. Guests wishing to experience this attraction will be required to pass through a metal detector as loose articles are strictly prohibited on this attraction.
Thursday, Apr 17 vs a typical Thursday
Standby wait through the day, against the average of the last 8 Thursdays
Average
39 min
Lowest
15 min 10:13am
Highest
100 min 1:02pm
Best times to go
Shortest waits usually come around 10am and 11am, and Fri runs about 24 min shorter than Sun.
Average standby each hour, day by day
| 10am | 11am | 12pm | 1pm | 2pm | 3pm | 4pm | 5pm | 6pm | 7pm | 8pm | 9pm | |
|---|---|---|---|---|---|---|---|---|---|---|---|---|
| Mon | · | 25 | · | 35 | 20 | 30 | · | · | 53 | 50 | · | 75 |
| Tue | · | · | 55 | · | 38 | 39 | · | 40 | · | 68 | · | · |
| Wed | · | 31 | 30 | 15 | · | · | · | · | 35 | 60 | 53 | · |
| Thu | 20 | · | 46 | 41 | 30 | 19 | · | · | 18 | · | 37 | · |
| Fri | · | · | · | 18 | · | 30 | 15 | · | · | 25 | 35 | 56 |
| Sat | · | 15 | 45 | 53 | 45 | 75 | 35 | · | · | · | 45 | 68 |
| Sun | · | · | 47 | 48 | 50 | · | 60 | 40 | 43 | 40 | 65 | 90 |
Average standby in minutes, last 60 days.
History
Average
29 min
Lowest
10 min Dec 7
Highest
93 min Feb 2
Average
28 min
Lowest
10 min Dec 7
Highest
91 min Feb 1
Average
35 min
Lowest
23 min Jun 2026
Highest
51 min Jul 2025
Average
36 min
Lowest
32 min 2026
Highest
40 min 2025
Ride status
Down once for 2h 13m in total
- 10:21am – 12:34pm 2h 13m
Broke down on 20 of the 25 days it ran in the last 30 days.