Mickey & Minnie's Runaway Railway Wait Times
Average that day
38min
Thu, Feb 12
Hours
8am–8pm
Special ticketed event 8pm–1am
Range
5–65 min
Low 8:50am · high 1:35pm
Typical Thursday
29 min
9 min busier that day
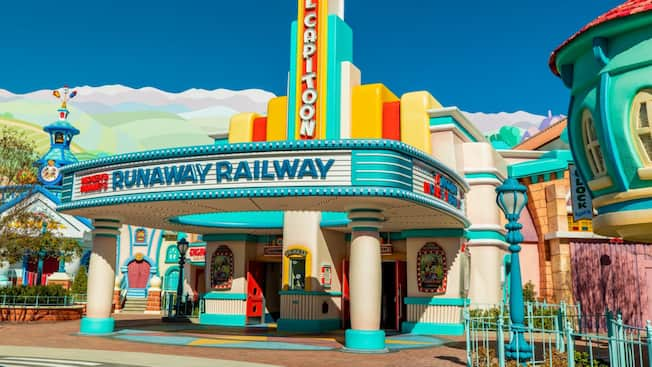 Photo: Disney
Mickey & Minnie's Runaway Railway is an immersive dark ride located in Mickey's Toontown within Disneyland Park at the Disneyland Resort. Guests embark on a slow-paced, animated adventure through a whimsical cartoon universe, featuring Mickey and Minnie Mouse in a unique, story-driven experience suitable for all ages and heights. The attraction combines vibrant visuals, signature Disney sound effects, and interactive elements that transport riders into a dynamic, ever-changing world.
Thursday, Feb 12 vs a typical Thursday
Standby wait through the day, against the average of the last 8 Thursdays
Average
38 min
Lowest
5 min 8:50am
Highest
65 min 1:35pm
Best times to go
Shortest waits usually come around 12am and 8am, and Tue runs about 12 min shorter than Sat.
Average standby each hour, day by day
| 12am | 6am | 8am | 9am | 10am | 11am | 12pm | 1pm | 2pm | 3pm | 4pm | 5pm | 6pm | 7pm | 8pm | 9pm | 10pm | 11pm | |
|---|---|---|---|---|---|---|---|---|---|---|---|---|---|---|---|---|---|---|
| Mon | 11 | 30 | 7 | 20 | 35 | 41 | 43 | 44 | 53 | 51 | 51 | 44 | 44 | 36 | 32 | 23 | 16 | 16 |
| Tue | · | · | 6 | 11 | 26 | 35 | 35 | 36 | 35 | 34 | 38 | 35 | 33 | 29 | 18 | 14 | 12 | 8 |
| Wed | 8 | · | 6 | 15 | 26 | 34 | 32 | 33 | 37 | 37 | 39 | 37 | 35 | 31 | 27 | 15 | 13 | · |
| Thu | · | · | 7 | 15 | 27 | 33 | 36 | 39 | 37 | 39 | 41 | 37 | 39 | 35 | 23 | 16 | 23 | 14 |
| Fri | 8 | · | 7 | 16 | 31 | 35 | 41 | 42 | 42 | 43 | 45 | 43 | 48 | 38 | 33 | 22 | 22 | 19 |
| Sat | 15 | · | 8 | 23 | 38 | 46 | 46 | 48 | 51 | 55 | 52 | 54 | 50 | 39 | 50 | 18 | 24 | 13 |
| Sun | 10 | · | 8 | 24 | 37 | 42 | 44 | 42 | 48 | 48 | 47 | 41 | 46 | 30 | 15 | 15 | 19 | 11 |
Average standby in minutes, last 60 days.
History
Average
32 min
Lowest
10 min Aug 31
Highest
55 min Jan 2
Average
34 min
Lowest
12 min Jul 5
Highest
47 min Jan 4
Average
32 min
Lowest
22 min Aug 2026
Highest
38 min Nov 2025
Average
35 min
Lowest
32 min 2026
Highest
40 min 2023
Ride status
Down twice for 1h 59m in total
- 8:11am – 8:50am 39m
- 10:20am – 11:41am 1h 20m
Broke down on 29 of the 30 days it ran in the last 30 days.