Mickey & Minnie's Runaway Railway Wait Times
Average that day
33min
Thu, Jul 24
Hours
8am–8pm
10:30pm–12am
Range
10–65 min
Low 9:38am · high 3:17pm
Typical Thursday
25 min
8 min busier that day
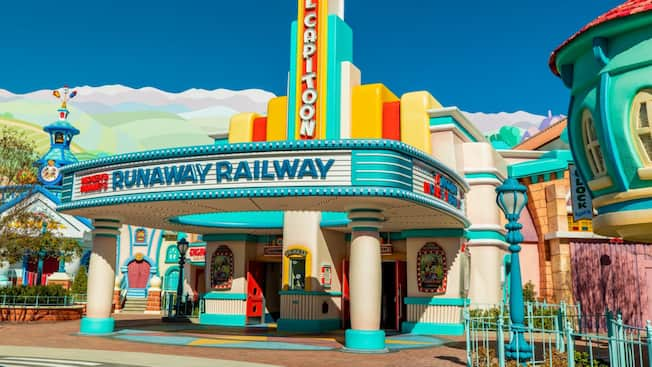 Photo: Disney
Mickey & Minnie's Runaway Railway is an immersive dark ride located in Mickey's Toontown within Disneyland Park at the Disneyland Resort. Guests embark on a slow-paced, animated adventure through a whimsical cartoon universe, featuring Mickey and Minnie Mouse in a unique, story-driven experience suitable for all ages and heights. The attraction combines vibrant visuals, signature Disney sound effects, and interactive elements that transport riders into a dynamic, ever-changing world.
Thursday, Jul 24 vs a typical Thursday
Standby wait through the day, against the average of the last 8 Thursdays
Average
33 min
Lowest
10 min 9:38am
Highest
65 min 3:17pm
Best times to go
Shortest waits usually come around 8am and 9pm, and Mon runs about 7 min shorter than Tue.
Average standby each hour, day by day
| 12am | 8am | 9am | 10am | 11am | 12pm | 1pm | 2pm | 3pm | 4pm | 5pm | 6pm | 7pm | 8pm | 9pm | 10pm | 11pm | |
|---|---|---|---|---|---|---|---|---|---|---|---|---|---|---|---|---|---|
| Mon | 8 | 5 | 8 | 19 | 31 | 29 | 27 | 32 | 30 | 30 | 28 | 26 | 23 | 15 | · | 13 | 10 |
| Tue | 8 | 6 | 13 | 31 | 36 | 36 | 36 | 41 | 42 | 43 | 40 | 42 | 28 | 18 | · | 12 | 12 |
| Wed | 10 | 5 | 8 | 18 | 24 | 26 | 32 | 32 | 34 | 35 | 35 | 30 | 26 | 5 | · | 13 | 9 |
| Thu | 8 | 6 | 14 | 25 | 31 | 34 | 30 | 30 | 39 | 39 | 36 | 36 | 29 | · | 8 | 13 | 12 |
| Fri | 15 | 6 | 8 | 22 | 28 | 31 | 29 | 36 | 30 | 31 | 34 | 36 | 32 | 30 | · | 14 | 9 |
| Sat | · | 6 | 11 | 19 | 33 | 30 | 32 | 33 | 35 | 40 | 33 | 34 | 31 | · | · | 18 | 13 |
| Sun | 5 | 5 | 10 | 19 | 32 | 35 | 36 | 34 | 35 | 35 | 32 | 32 | 24 | 25 | · | 13 | 9 |
Average standby in minutes, last 60 days.
History
Average
32 min
Lowest
10 min Aug 31
Highest
55 min Jan 2
Average
34 min
Lowest
12 min Jul 5
Highest
47 min Jan 4
Average
32 min
Lowest
22 min Aug 2026
Highest
38 min Nov 2025
Average
35 min
Lowest
32 min 2026
Highest
40 min 2023
Ride status
Down 5 times for 4h 27m in total
- 8:11am – 9:38am 1h 27m
- 11:44am – 11:50am 6m
- 1:29pm – 2:20pm 51m
- 4:44pm – 5:44pm 1h
- 6:44pm – 7:47pm 1h 3m
Broke down on 29 of the 30 days it ran in the last 30 days.