
Haunted Mansion Holiday Wait Times
Average that day
19min
Tue, Jun 16
Hours
8am–8pm
Special ticketed event 9pm–1am
Range
10–40 min
Low 3:16pm · high 12:49pm
Typical Tuesday
33 min
14 min quieter that day
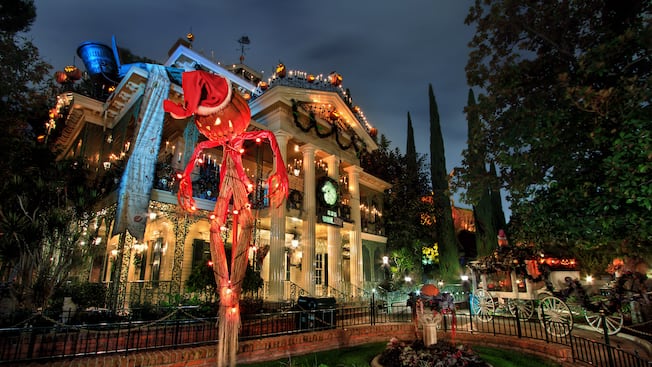 Photo: Disney
The Haunted Mansion Holiday is a seasonal overlay of the classic Haunted Mansion attraction located in New Orleans Square at Disneyland Park. This unique version features decorations and characters inspired by *Tim Burton’s The Nightmare Before Christmas*, transforming the eerie estate into a festive yet macabre holiday experience. Guests can encounter familiar characters such as Sally and Oogie Boogie, and enjoy specially designed scenery and seasonal surprises throughout the ride.
Tuesday, Jun 16 vs a typical Tuesday
Standby wait through the day, against the average of the last 8 Tuesdays
Average
19 min
Lowest
10 min 3:16pm
Highest
40 min 12:49pm
Best times to go
Shortest waits usually come around 12am and 8am, and Fri runs about 3 min shorter than Sat.
Average standby each hour, day by day
| 12am | 8am | 9am | 10am | 11am | 12pm | 1pm | 2pm | 3pm | 4pm | 5pm | 6pm | 7pm | 8pm | 9pm | 10pm | 11pm | |
|---|---|---|---|---|---|---|---|---|---|---|---|---|---|---|---|---|---|
| Mon | · | 12 | 21 | 32 | 37 | 40 | 41 | 42 | 42 | 39 | 37 | 34 | 31 | 24 | 18 | 16 | 13 |
| Tue | 13 | 13 | 21 | 35 | 41 | 44 | 46 | 40 | 42 | 41 | 42 | 38 | 36 | 31 | 19 | 20 | 13 |
| Wed | 13 | 13 | 20 | 35 | 39 | 42 | 44 | 42 | 42 | 45 | 43 | 40 | 36 | 29 | 25 | 20 | 13 |
| Thu | 13 | 13 | 20 | 35 | 34 | 37 | 39 | 40 | 39 | 41 | 40 | 37 | 34 | 29 | 21 | 19 | 13 |
| Fri | 13 | 14 | 21 | 32 | 35 | 37 | 36 | 34 | 35 | 37 | 37 | 35 | 34 | 27 | 25 | 23 | 14 |
| Sat | · | 13 | 22 | 33 | 40 | 41 | 38 | 40 | 42 | 39 | 42 | 35 | 39 | 28 | 26 | 19 | 15 |
| Sun | · | 14 | 24 | 34 | 38 | 39 | 41 | 39 | 40 | 39 | 37 | 34 | 28 | 27 | 16 | 16 | 13 |
Average standby in minutes, last 60 days.
History
Average
35 min
Lowest
16 min Feb 3
Highest
61 min Oct 10
Average
37 min
Lowest
17 min Jul 5
Highest
59 min Oct 26
Average
37 min
Lowest
25 min Jul 2026
Highest
55 min Nov 2024
Average
39 min
Lowest
33 min 2026
Highest
47 min 2024
Ride status
Ran all day with no breakdowns
Broke down on 25 of the 30 days it ran in the last 30 days.