Monsters, Inc. Mike & Sulley to the Rescue! Wait Times
Average that day
34min
Wed, Jun 4
Hours
8am–9pm
Early entry 7:30am–8am · Special ticketed event 9pm–2am
Range
5–60 min
Low 7:33am · high 3:00pm
Typical Wednesday
28 min
6 min busier that day
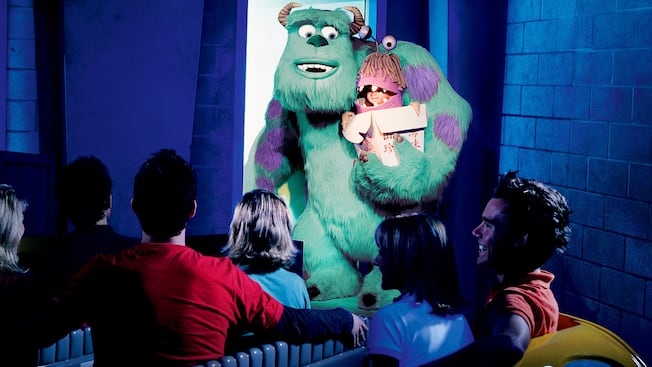 Photo: Disney
Monsters, Inc. Mike & Sulley to the Rescue! is an indoor dark ride located in Hollywood Land at Disney California Adventure Park within the Disneyland Resort. The attraction immerses guests in scenes from the Disney·Pixar film “Monsters, Inc.,” featuring a slow-paced taxi ride through Monstropolis alongside the characters Mike and Sulley. Designed for preschoolers, kids, and tweens of any height, the ride combines dim lighting, sound effects, and familiar film settings to guide guests on a mission to return Boo to her bedroom.
Wednesday, Jun 4 vs a typical Wednesday
Standby wait through the day, against the average of the last 8 Wednesdays
Average
34 min
Lowest
5 min 7:33am
Highest
60 min 3:00pm
Best times to go
Shortest waits usually come around 7am and 11pm, and Fri runs about 9 min shorter than Thu.
Average standby each hour, day by day
| 12am | 1am | 7am | 8am | 9am | 10am | 11am | 12pm | 1pm | 2pm | 3pm | 4pm | 5pm | 6pm | 7pm | 8pm | 9pm | 10pm | 11pm | |
|---|---|---|---|---|---|---|---|---|---|---|---|---|---|---|---|---|---|---|---|
| Mon | 5 | · | 5 | 6 | 12 | 26 | 34 | 39 | 39 | 37 | 46 | 39 | 40 | 35 | 32 | 21 | 8 | · | · |
| Tue | 5 | · | · | 5 | 20 | 33 | 39 | 35 | 41 | 38 | 36 | 43 | 49 | 48 | 35 | 32 | 18 | 8 | 5 |
| Wed | 5 | · | 5 | 7 | 17 | 31 | 37 | 36 | 42 | 38 | 44 | 40 | 40 | 37 | 37 | 21 | 20 | 14 | · |
| Thu | 15 | · | · | 8 | 16 | 28 | 36 | 40 | 41 | 39 | 42 | 42 | 36 | 41 | 39 | 29 | 16 | 20 | · |
| Fri | 10 | 10 | 5 | 5 | 9 | 21 | 31 | 31 | 29 | 28 | 38 | 34 | 34 | 39 | 24 | 30 | 16 | 10 | 5 |
| Sat | 5 | · | · | 5 | 13 | 33 | 43 | 39 | 37 | 36 | 41 | 47 | 44 | 38 | 33 | 27 | 15 | 18 | · |
| Sun | · | · | 7 | 6 | 16 | 32 | 37 | 36 | 34 | 41 | 41 | 37 | 41 | 34 | 33 | 23 | 12 | 10 | · |
Average standby in minutes, last 60 days.
History
Average
34 min
Lowest
14 min Sep 10
Highest
65 min Jan 3
Average
34 min
Lowest
15 min Jul 5
Highest
53 min Dec 28
Average
33 min
Lowest
23 min Nov 2026
Highest
40 min Jan 2026
Average
34 min
Lowest
33 min 2024
Highest
35 min 2022
Ride status
Down twice for 55m in total
- 5:18pm – 5:54pm 36m
- 8:21pm – 8:40pm 19m
Broke down on 24 of the 30 days it ran in the last 30 days.